Pharmacy Technician Employment: How is the Job Market for Pharmacy Technicians?

Politicians, the people, and industry insiders have debated and disagreed on the topic of healthcare for decades, but one course has remained stable. From the Medicare and Medicaid programs, which were signed into law on July 30, 1965, to today’s Patient Protection and Affordable Care Act (PPACA), better known as “Obamacare,” the healthcare industry continues to adjust for the times. These positive adjustments are prevalent in all facets of healthcare from the number of new medical facilities erected each year to explosive employment and salary growth in just about every healthcare occupation.
According to the Bureau of Labor Statistics, industries and occupations related to health care, personal care and social assistance (and construction) are projected to have the fastest job growth between 2010 and 2020. The Bureau offers the following data related to healthcare occupations overall:
Healthcare occupations. Employment among healthcare occupations is expected to increase by 29 percent. This growth, resulting in a projected 3.5 million new jobs, will be driven by increasing demand for healthcare services. As the number of elderly individuals continues to grow, and as new developments allow for the treatment of more medical conditions, more healthcare professionals will be needed. Within this group, two occupations are expected to add a substantial number of jobs: registered nurses, with some 711,900 new jobs; and home health aides, with roughly 706,300 new jobs. Much of the growth in this pair of occupations will be the result of increased demand for healthcare services as the expanding elderly population requires more care.
Healthcare and social assistance. The healthcare and social assistance industry is projected to create about 28 percent of all new jobs created in the U.S. economy. This industry—which includes public and private hospitals, nursing and residential care facilities, and individual and family services—is expected to grow by 33 percent, or 5.7 million new jobs. Employment growth will be driven by an aging population and longer life expectancies, as well as new treatments and technologies.
Of the many healthcare occupations, several dozen are expected to experience the most rapid growth. Just a few include:
Personal Care Aides – 70% change
Home Health Aides – 69% change
Pharmacy Technicians – 32% change
Registered Nurses – 26% change
Pharmacists – 25% change
Nursing Aides, Orderlies, and Attendants – 20% change
Pharmacy Technician Employment
Pharmacy technicians are expected to enjoy a much faster than average increase in employment overall between 2010 and 2020 for many of the same reasons the healthcare industry as a whole is growing. According to the Bureau, in addition to an aging population that depends on prescription drugs more than the younger population, advances in pharmaceutical research have led to more effective prescription medications that are being used to combat diseases. The following are just a few facts to mull over:
U.S. Population 65 and over
Year 2010: 38,600,000
Year 2005: 35,200,000
Year 2000: 32,600,000
Year 1990: 29,600,000
Number of Prescriptions Filled (at retail pharmacies only)
Year 2010: 3,703,594,389
Year 2005: 3.6 billion
Year 2000: 2.9 billion
Year 1994: 2.1 billion
Prescription Drug Use
65 and over: 85% males, 89% females
50-64: 67% males, 83% females
35-49: 53% males, 70% females
18-34: 40% males, 66% females
Employment Growth for Pharmacy Technicians
Employment Change 2010-2020: 108,300
Employment Today: 334,400
Employment Year 2005: 266,790
Employment Year 2000: 143,460
While employment growth for pharmacy technicians is projected to be much faster than average overall for the 2010-2020 decade, some states (and cities) will experience a larger jump than others. At the top of the list of five states with the highest employment levels for pharmacy technicians is California. The state is home to 28,670 pharmacy technicians, up from 22,140 in 2005. The other four states with the highest employment levels are:
Texas
Employment 2005: 22,000
Employment Today: 28,260
Florida
Employment 2005: 18,540
Employment Today: 21,760
New York
Employment 2005: 11,260
Employment Today: 15,730
Illinois
Employment 2005: 14,410
Employment Today: 15,630
While California has the highest employment levels for pharmacy technicians overall, three metropolitan areas have higher employment levels than the populous Los Angeles-Long Beach-Glendale, CA metropolitan area. They are the Chicago-Joliet-Naperville, IL Metro area, New York-White Plains-Wayne, NY-NJ, and Houston-Sugar Land-Baytown, TX.
Including the metro areas listed above, the following metro areas (consisting of one to three major cites) have the highest employment levels in the country. This means, aspiring pharmacy technicians have a better chance of landing a job in these cities over most all others.
Metro Area: Chicago-Joliet-Naperville, IL
Employment: 9,210
New York-White Plains-Wayne, NY-NJ
Employment: 8,270
Houston-Sugar Land-Baytown, TX
Employment: 7,320
Los Angeles-Long Beach-Glendale, CA
Employment: 6,570
Atlanta-Sandy Springs-Marietta, GA
Employment: 5,140
Dallas-Plano-Irving, TX
Employment: 4,790
Philadelphia, PA
Employment: 4,420
Minneapolis-St. Paul-Bloomington, MN-WI
Employment: 4,400
Phoenix-Mesa-Glendale, AZ
Employment: 4,320
Tampa-St. Petersburg-Clearwater, FL
Employment: 4,310
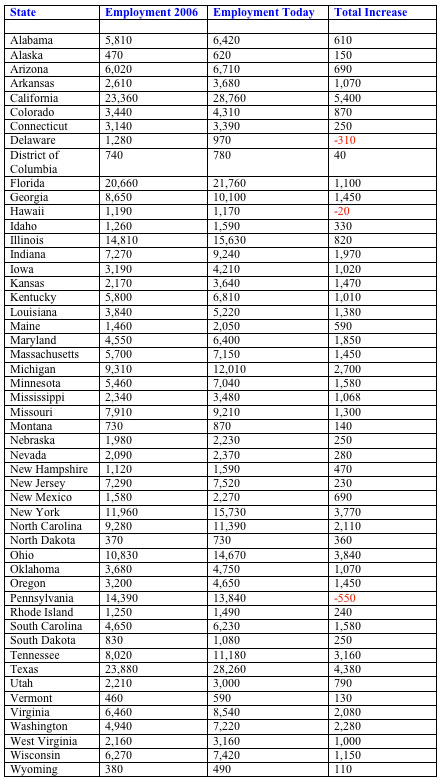
Pharmacy Technician Employment Trends by State
While the 28 cities listed above are at the top of the list of cities for jobs for pharmacy technicians, most states have experienced promising employment growth overall between 2006 and today. The following list includes employment information for all 50 states and D.C. With the exception of Delaware, Hawaii, and Pennsylvania, employment increases total several hundred to well over several thousand per state. It is important to note that while Pennsylvania lost jobs between 2006 and today, the state still has one of the highest populations of pharmacy technicians in the U.S.
The states that showed the most significant employment increases between 2006 and today include California, Indiana, Maryland, Michigan, New York, North Carolina, Ohio, Tennessee, Texas, Virginia, and Washington.
Sources
Centers for Medicare & Medicaid Services, www.cms.gov
National Committee on Vital and Health Statistics (NCVHS), www.ncvhs.gov
The Center on an Aging Society, Institute for Health Care Research and Policy, Georgetown University, www.hpu.georgetown.edu
The Henry J. Kaiser Family Foundation, www.statehealthfacts.org
U.S. Department of Commerce, United States Census Bureau, www.census.gov
U.S. Government Printing Office (GPO), www.gpo.gov
United States Department of Labor Bureau of Labor Statistics, www.bls.gov

- Facebook Like
- Google Plus One
- 63950 reads

